Fractional CTO +
Senior Engineering
Strategy Meets Execution
Technology leadership for your company - strategic roadmaps, architecture decisions, and team mentorship. PLUS hands-on execution in AI/ML, data interopability, and full-stack engineering.


Regain Your Flow
Long-Term C2C Contracts
Senior engineers who integrate seamlessly into your team for 6-12+ month engagements.
- Autonomous execution with senior-level judgment
- Hit the ground running with experienced engineers
- AI/ML, full-stack, DevOps, and security expertise
Project-Based Consulting
Fixed-scope engagements for AI prototypes, automation systems, or technical debt resolution.
- Build RAG pipelines, ML models, and agentic systems
- Modernize legacy code and infrastructure
- Deploy production-grade solutions on your stack
Featured Case Studies
Real projects. Real results. See how we've delivered for clients across industries.
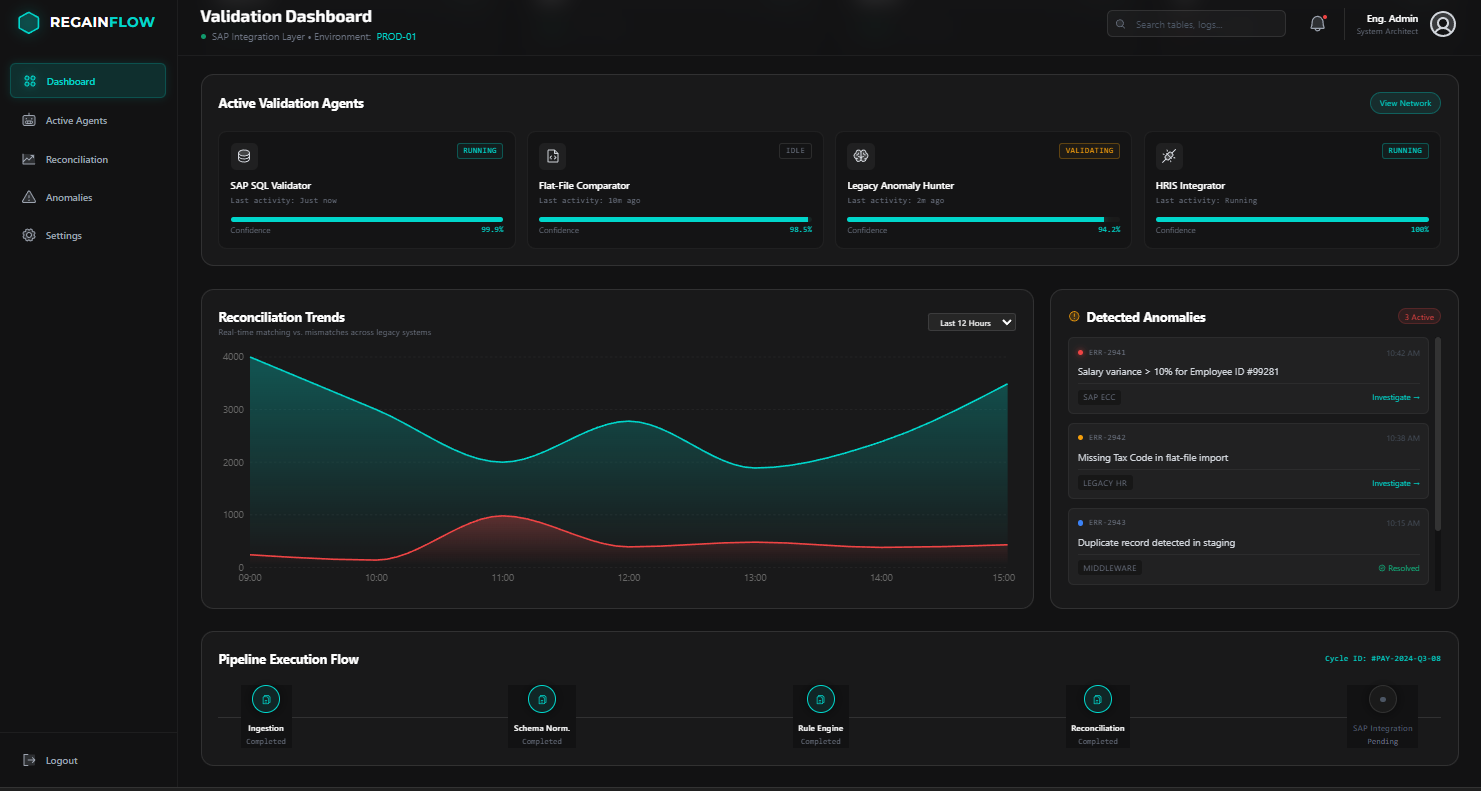
Multi-Agent Payroll Validation System
Autonomous validation engine replacing months of manual SAP payroll quality checks. Multi-agent architecture orchestrating SQL validation, flat-file comparisons, and AI-generated logic across legacy systems.
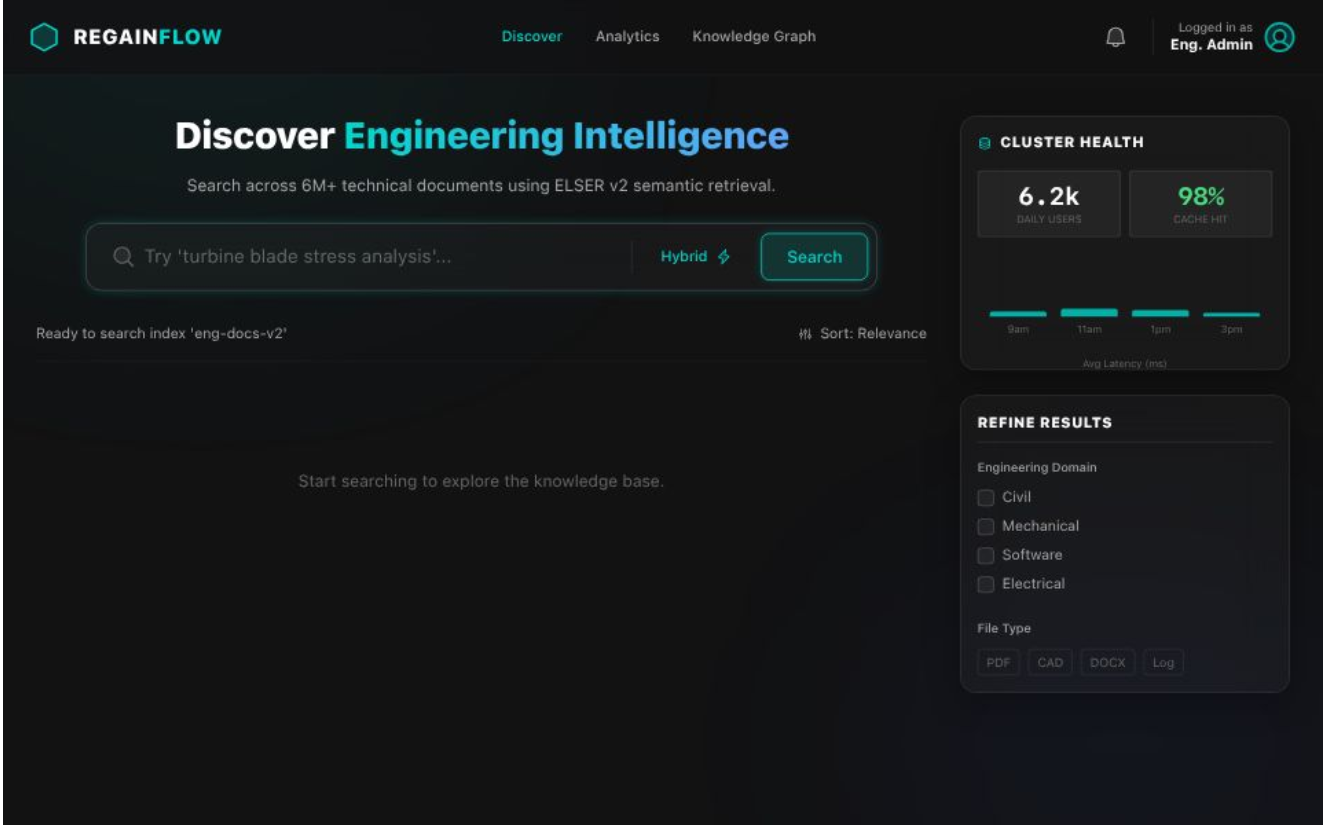
Hybrid RAG for Aerospace Engineering Search
Production search engine using ELSER V2 and Elasticsearch serving 6,000+ daily users. Hybrid semantic + keyword retrieval over millions of engineering documents with domain-specific accuracy.
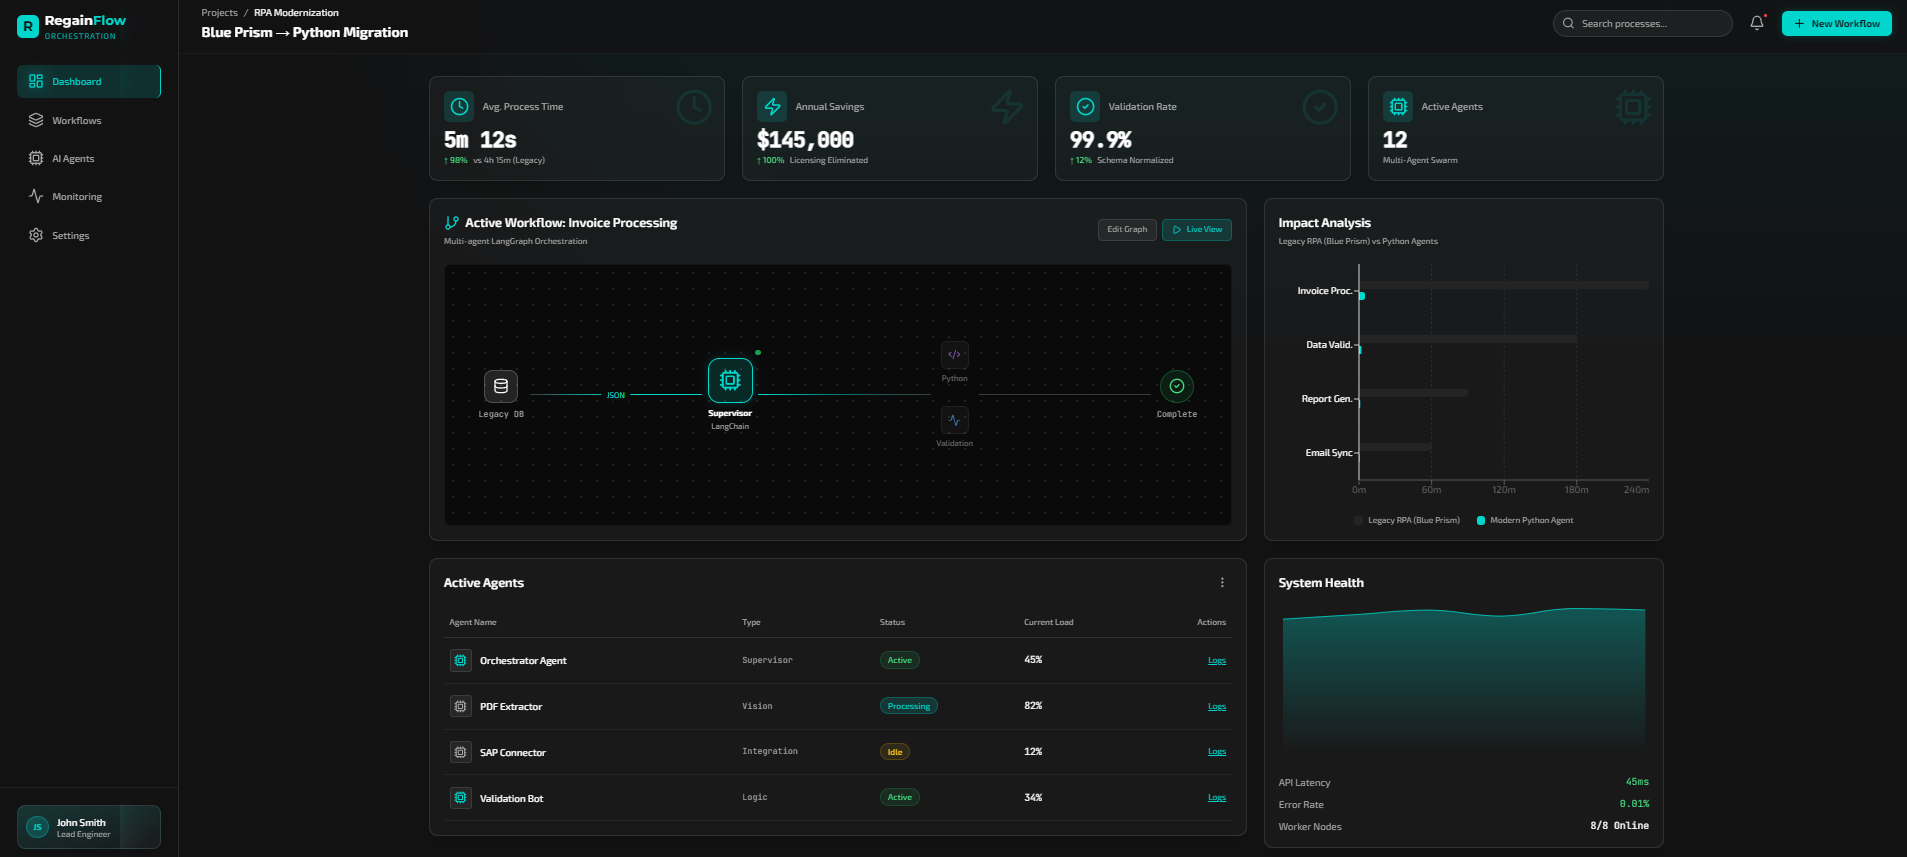
Legacy RPA Modernization with Python & LangGraph
Converted Blue Prism legacy automations into modern Python workflows with multi-agent AI orchestration. Eliminated licensing costs, improved reliability, and reduced multi-hour processes to minutes.
How It Works
Four simple steps to get senior engineering talent on your team
Initial Consultation
Schedule a free consultation to discuss your technical requirements, timeline, and budget. We'll assess your needs and match you with the right senior engineer.
Engineer Selection
Review profiles of our pre-vetted senior engineers. Each profile includes technical expertise, past projects, and client testimonials. Choose the engineer that best fits your project.
Contract & Onboarding
Finalize C2C contract terms or project scope. Our engineer will integrate with your team, access your systems, and begin delivering production-ready code immediately.
Delivery & Support
Your engineer ships features, fixes bugs, and maintains code quality. Regular check-ins ensure alignment. Scale up or down as needed with flexible engagement terms.
Frequently Asked Questions
Everything you need to know about working with Regain Flow
Ready to Ship Faster?
Stop wasting time on lengthy hiring processes. Get production-ready senior engineers on your team in days, not months.
Free consultation · No commitment · Flexible engagement terms